
Understanding HRV, ANS, heart rate, oxygen saturation and temperature, and connecting them with a young athlete’s perceived effort

In the morning, the app shows seven hours of sleep, an HRV of 65 ms and an ANS Charge of −1. Another panel displays a green 78%. Training is about to start, a parent wonders whether their child has rested, and the athlete simply says, “Getting up felt really hard today.”
All of that information can help. The difficulty begins when the numbers look familiar but we do not really know what they describe. Should HRV always be higher? Does 96% sleep efficiency mean excellent sleep? Does a green recovery score mean it is time for a hard session?
You do not need a physiology degree to use a wearable. You do need to distinguish a measurement from an algorithm’s assessment and know what to compare the result with.
Start with the units
HR 59 bpm means 59 heartbeats per minute. HRV 65 ms describes differences between the intervals separating successive beats, in milliseconds. SpO₂ 98% concerns the oxygen saturation of haemoglobin, while 78% Recovery is a WHOOP algorithm score. Those two percentages mean very different things.
Similarly, ANS −1 is a position on a Polar scale, 33.6°C may be skin temperature, and 600 AU may be a training load calculated from perceived effort and session duration. We cannot add or average these numbers into a single “true recovery” value. Each answers a different question.
Wearables use optical and movement sensors, among other inputs. They infer sleep and its stages from indirect signals. They do not record brain activity in the way a sleep study with EEG does. The results can help us follow everyday patterns, but there are limits to the accuracy of each minute assigned to a sleep stage. How WHOOP identifies sleep.
How much sleep there was and what happened overnight
For an athlete aged 13–16, the first question is straightforward: was there enough time for sleep? The American Academy of Sleep Medicine recommends 8–10 hours of sleep per 24 hours on a regular basis for ages 13–18. A high wearable score does not replace that need. AASM recommendations.
Several similar labels appear in sleep panels. It helps to separate them.
| Metric | What it means in everyday terms |
|---|---|
| Sleep onset and wake time | Where sleep fits into the day. They can reveal a late bedtime before an early session. |
| Time in bed | The window set aside for sleep, including time spent falling asleep and periods awake. |
| Sleep duration | Check the manufacturer’s definition. WHOOP distinguishes time in bed from time asleep; Polar also reports the period from falling asleep to final awakening and the proportion actually spent asleep within it. |
| Sleep latency | The time between trying to fall asleep and actually falling asleep, if the app can establish that starting point. |
| Awakenings | This may mean a count or the total time awake. “15 min” does not mean fifteen awakenings. |
| Sleep continuity | Polar rates this from 1 to 5. A higher value means less fragmented sleep. |
Sleep efficiency describes the proportion of a particular window actually spent asleep. WHOOP uses time asleep as a proportion of time in bed. For example, seven hours asleep during eight hours in bed gives 87.5%. Polar’s “actual sleep” expresses uninterrupted sleep time as a proportion of the detected sleep period. Before comparing percentages, check which time window was used. WHOOP sleep definitions, Polar Sleep Plus Stages metrics.
An athlete can therefore sleep through almost all of a short window, achieve high efficiency, and still not get enough sleep. For a fifteen-year-old whose nights regularly end after seven hours, the conversation should also cover the daily schedule, travel and training times.
Sleep consistency concerns similar bedtimes and wake times. Sleep need is an algorithm’s estimate. WHOOP considers inputs including a personal baseline, strain, earlier shortfalls and naps. Sleep debt describes a calculated shortfall from previous nights. It is not an exact biological account that can be settled to the minute. How WHOOP estimates sleep need.
Light sleep, deep sleep and REM
Sleep unfolds in repeated cycles. We move through different stages, and brief awakenings can be a normal part of the night.
Light sleep includes stages N1 and N2. It is a substantial, necessary part of sleep during which we are easier to wake. A large share of light sleep does not mean that time was wasted.
Deep sleep, also called N3 or slow-wave sleep, is a stage from which it is harder to wake. It is associated with restorative processes, but its duration cannot be converted into a percentage of muscle repair.
REM involves rapid eye movements, an active brain and frequent dreaming. It matters for processes including memory and learning. Deep sleep and REM do not operate as two separate services, one exclusively for the body and the other exclusively for the mind. Sleep stages and cycles explained by NIH.
The app may show both minutes and a percentage of total sleep. Always consider them together: 20% of a short night can be fewer minutes than a smaller proportion of a longer one. A single wearable reading is also no reason to give a teenager a target of “more REM at any cost”.
Polar’s sleep score, on a scale of 1–100, combines six elements: sleep duration, long interruptions, continuity, actual sleep percentage, deep sleep percentage and REM percentage. WHOOP Sleep Performance, in the manufacturer’s current description, considers sleep obtained versus need, consistency, efficiency and physiological stress during sleep. That last component assesses bodily activation; it does not read thoughts or dreams. The two companies calculate their scores differently. Polar sleep scoring, WHOOP Sleep Performance.
HR and HRV describe different aspects of the heartbeat
HR stands for heart rate, and bpm means beats per minute. RHR is resting heart rate. A training panel, by contrast, may display average and maximum heart rate during exercise. These values come from different conditions and are not interchangeable.
Imagine an athlete whose overnight heart rate is usually around 52 bpm but remains closer to 60 for several nights. That change is worth considering alongside training load, sleep and how she feels. The increase alone cannot tell us whether it reflects hard training, stress or an emerging illness. A lower heart rate is not a daily target to keep improving, either. Heart rate and overnight recovery in Polar.
HRV, heart rate variability, describes variation in the intervals between successive heartbeats. Even at 60 bpm, the heart does not work like a perfect metronome. One interval might last 0.98 seconds and the next 1.02 seconds.
RMSSD is a way of calculating that variability: it describes how much successive intervals differ. The result is expressed in milliseconds, or thousandths of a second. An HRV of 65 ms does not mean a heart rate of 65 or recovery of 65%. HRV and RMSSD in Polar’s documentation.
HRV helps us observe the autonomic nervous system’s regulation of the heart. Its value also depends on the person, the conditions and the measurement method. The most useful question is therefore: how does today’s result compare with this person’s usual values, measured in the same way? There is no single number every athlete aged 13–16 should reach. WHOOP’s explanation of HRV and RMSSD.
If the usual level is around 78 ms, a reading of 65 ms is roughly 17% lower. That does not mean a loss of 17% of the athlete’s strength. It means one particular metric differs from its baseline. A teammate’s HRV of 90 ms is not a target for the whole squad, and another wearable may use a different part of the night. Follow the athlete’s own range and trend instead of trying to set a new HRV record every day.
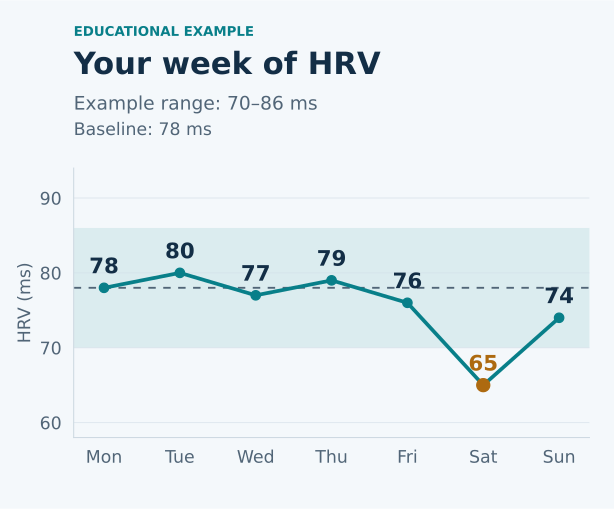
An illustrative week of HRV. The shaded area represents a personal reference range in this example, not a medical standard. A reading of 65 ms can be understood in relation to the athlete’s own history.
ANS Charge and Nightly Recharge in Polar Loop
ANS stands for autonomic nervous system. It regulates many processes without conscious control, including the heartbeat. Its sympathetic branch helps mobilise the body; the parasympathetic branch is involved in slowing the heart and supporting rest, among other functions.
ANS Charge is Polar’s assessment based on heart rate, HRV and breathing rate during approximately the first four hours of sleep. Its scale runs from −10 to +10, with values around zero representing the person’s usual level. A result of −1 therefore sits slightly below that level; it does not mean “minus one per cent recovery”.
Nightly Recharge is a broader assessment. It combines ANS Charge with sleep charge and compares the night with the person’s history over the previous 28 days. Nightly Recharge in Polar Loop.
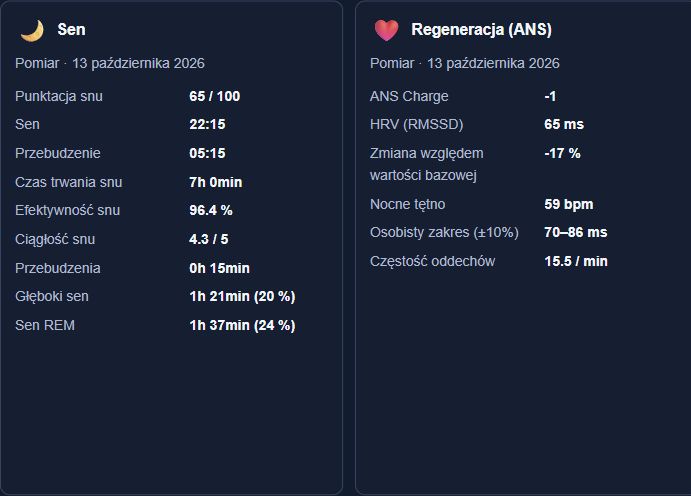
Sleep and the body’s response side by side. The coach sees the length and structure of the night alongside HRV, overnight heart rate and deviation from baseline.
This panel shows a seven-hour sleep window, fifteen minutes of awakenings and high efficiency of 96.4%. It is a useful example of why the percentage alone is not enough. Beside it are an HRV of 65 ms and a change of −17%. The displayed range of 70–86 ms is a personal reference band in this example, not a medical standard for teenagers.
The overnight 59 bpm in the ANS card relates to the measurement used by Polar. It need not match WHOOP RHR, which the manufacturer determines using its own method.
Breathing rate, oxygen saturation and skin temperature
These measurements can reveal a change that sleep duration alone does not explain.
RR in a breathing panel, respiratory rate, is the number of breaths per minute. A reading of 14.3/min means an average of just over fourteen breaths per minute during the sleep being analysed. A sustained increase from the person’s usual level may accompany greater physiological strain and calls for a closer look at the context. Breathing as slowly as possible at night is not the goal. Be careful with the abbreviation: in heart analysis, “RR intervals” means intervals between heartbeats, not breathing rate. Respiratory rate in WHOOP.
SpO₂, often called oxygen saturation or simply “O₂”, estimates the percentage of haemoglobin in arterial blood bound to oxygen. Haemoglobin is the protein that transports that oxygen. A reading of 98% does not mean that 98% of the blood consists of oxygen. Nor is it a fitness score or VO₂max, the body’s maximum capacity to use oxygen during exercise.
Optical measurement has limitations. Circulation, skin temperature and pigmentation can affect readings, while a wearable also depends on good sensor contact. A single low result calls for checking the measurement; repeated unusual readings or concerning symptoms should not simply be attributed to training. The FDA’s explanation of oxygen saturation and measurement limits.
TMP or TEMP means temperature. In the WHOOP card this is skin temperature, rather than internal body temperature measured with a thermometer. The displayed 33.6°C therefore does not indicate hypothermia. Changes from the person’s baseline are particularly useful to follow. The surroundings also affect skin temperature; a deviation of +0.6°C does not by itself establish a fever. Skin temperature explained by WHOOP.
For athletes who menstruate, some changes in temperature, heart rate and HRV may relate to the phase of their cycle. WHOOP also offers ways to follow these relationships. That is another reason not to automatically explain the same change in two people in the same way, or treat every rise in temperature as an infection. The menstrual cycle and WHOOP measurements.
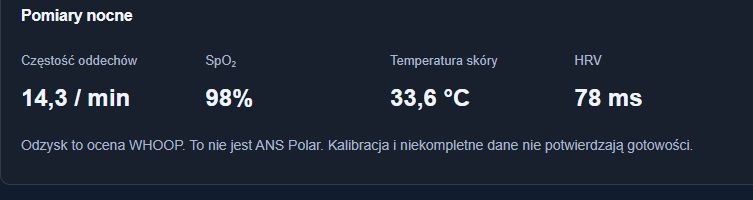
Four values providing four different pieces of information. Their changes against the athlete’s history, and whether they agree with how the athlete feels, give them meaning.
Not every wearable provides the same measurements. The saturation and temperature in this screenshot come from the WHOOP module; they are not components of Polar ANS Charge.
What the WHOOP Recovery percentage actually means
Recovery is an algorithm’s assessment on a 0–100% scale. The manufacturer uses inputs including HRV, resting heart rate, sleep and breathing information, and available skin temperature and SpO₂ measurements, comparing results with the user’s own history. It is not a simple average of the numbers on screen. Recovery explained, Recovery data in WHOOP’s documentation.
WHOOP displays 67–100% in green, 34–66% in yellow and 0–33% in red. The colour makes the manufacturer’s assessment quick to read. However, 78% does not mean that the muscles, nervous system and whole body have regained exactly 78% of their capacity.
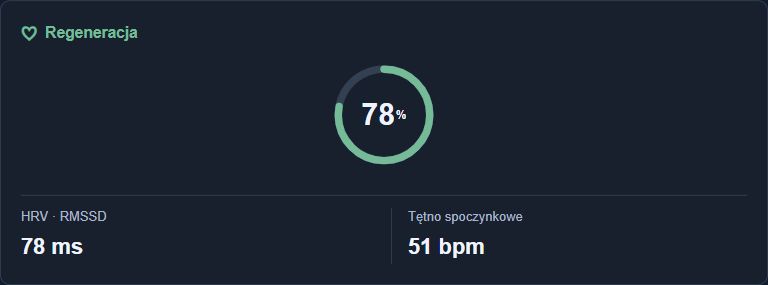
Read Recovery alongside its measurements. Next to 78%, an HRV of 78 ms and resting heart rate of 51 bpm help put the assessment in context.
A green result does not explain shoulder pain or cancel out “I don’t feel well”. Equally, a single red day does not diagnose overtraining. The score describes signals the algorithm can account for; a training decision also needs a conversation and an assessment of the athlete’s situation.
Cardio Load and Strain describe load
Recovery panels often sit alongside figures from the previous session. Read them in the right order: first came the effort, then the night and the body’s response.
Polar Cardio Load describes cardiovascular training load calculated from heart rate and session duration. A value of 92 does not mean 92% fatigue. For longer-term analysis, Polar also uses Strain for the average daily load over seven days and Tolerance for the average over 28 days. These compare training histories; they do not measure the body’s resistance to injury. Polar Training Load Pro.
WHOOP Strain is a different assessment, on a 0–21 scale. It may describe one activity or a whole day and accounts for load using the manufacturer’s model. The scale is not linear: two sessions scored at 10 do not add up to 20. WHOOP Strain also differs from Polar’s seven-day Strain. How WHOOP Strain works.
Exercise heart rate, time in zones and estimated calories help describe a session. None replaces information about how demanding the session felt to that particular athlete.
RPE and sRPE bring in the athlete’s perspective
RPE is a rating of perceived exertion. On a commonly used 0–10 scale, zero means no effort and ten means maximal effort. When rating a session, the athlete answers, “How hard was the whole session for me?” Collect that response at an agreed time after training and relate it to the full session, not just the final hard interval.
In the session RPE method, we combine the rating with duration:
Session load = RPE rating × training duration in minutes.
For example, 90 minutes rated at 6 gives 540 AU. A 45-minute session with the same rating gives 270 AU. AU means arbitrary units. These are not calories or a percentage of energy used. Loads from several sessions can be added, provided ratings and durations are collected consistently. The session RPE method, research on its use with young athletes.
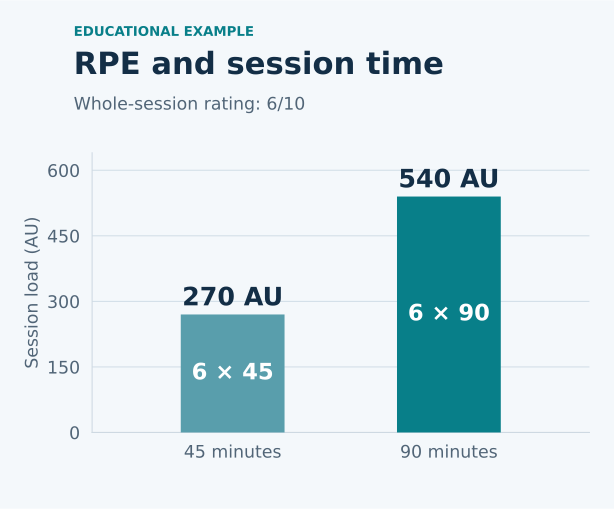
The same rating, a different load. At an RPE of 6, ninety minutes gives 540 AU and forty-five minutes gives 270 AU. The example shows why duration matters in the calculation.
The rating must come from the athlete. If a coach planned an easy session but a teenager found it hard, that difference is useful information. Correcting the answer to match the plan undermines the measurement.
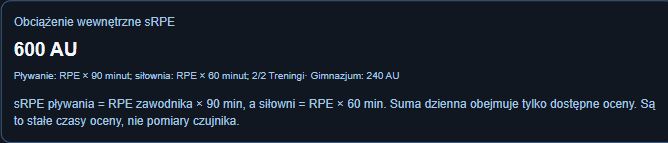
Read the load together with its calculation method. The card shows a value in AU and explains which session durations were used.
The VANTARO panel shown here uses fixed durations: 90 minutes for swimming and 60 minutes for gym work. As an arithmetic example, ratings of 4 for both sessions would give 4 × 90 + 4 × 60 = 600 AU. Such a value compares ratings under those assumptions. If actual session lengths vary, standard session RPE load needs to use the actual minutes; do not assume this panel automatically used the wearable’s recorded duration.
The term “sRPE” is sometimes used for the whole-session rating and sometimes as shorthand for the resulting load. The units help avoid confusion: 6/10 is a rating; 540 AU is a load.
How a coach can put the information together before training
Imagine a fifteen-year-old swimmer who usually rates a similar session at 4. On Monday he enters 7. On Tuesday morning we see shorter sleep, HRV below his usual level and higher overnight heart rate. He says he stayed up studying and his legs still feel heavy.
No single piece of information supplies a ready-made training decision. Together, though, they give the coach a reason to talk. The coach can see how he responds to the warm-up and decide whether to adjust the load or type of work. A parent can help explain why the next night might also be too short.
In VANTARO, a coach can move from the sleep and ANS cards to the Polar or WHOOP modules, then consider the results alongside session ratings. Before interpreting anything, check the measurement date and how up to date the synchronisation is. No new record does not mean zero, and data from several days ago does not describe this morning.
The most useful observation is a recurring pattern: particular sessions feel harder, sleep becomes shorter afterwards, and overnight readings increasingly differ from the athlete’s own history. That helps identify possible reasons and assess the response to changes in the plan. It does not provide a formula for predicting injury.
Persistent excessive sleepiness, loud snoring or observed pauses in breathing call for medical assessment, even when the wearable gives a reasonable sleep score. These signs in a child matter beyond the training schedule. NIH guidance on sleep-disordered breathing in children.
A useful morning review goes further than reading a colour. The coach knows which night the data comes from, how it compares with the athlete’s history and what effort preceded it. Then they listen to the person behind those numbers. That is when measurement starts to help coaching.
The app panels show illustrative data from VANTARO’s demo version. Screenshots retain the Polish interface.